Microsoft Power BI
Get more from your data investments by giving everyone in the company access to insights with Microsoft Power BI.
What is Microsoft Power BI?
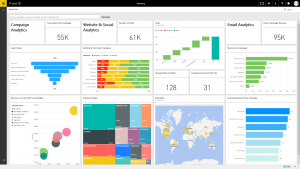
Microsoft Power BI is a cloud-based business analytics service that enables anyone to visualize and analyze data with greater speed, efficiency, and understanding. It connects users to a broad range of live data through easy-to-use dashboards, provides interactive reports, and delivers compelling visualizations that bring data to life.
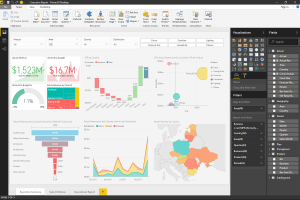
Power BI Desktop is a powerful visual data exploration and interactive reporting tool. It provides a free-form canvas for drag-and-drop exploration of your data and an extensive library of interactive visualizations, while streaming report creation and publishing to the Power BI service.
Excel is a data analysis tool. Take advantage of a familiar environment now with more power and capacity. Load and stay connected to all your data in one place, have the freedom and flexibility to shape and model to fit your business needs, then use powerful analysis to discover insights.
Experience your data, any data, any way, anywhere
Fast, easy access to the data you need
- Get started in seconds with a cloud-based service.
- Begin visualizing your data in minutes with content packs providing pre-built dashboards and reports created by your organization or by popular service providers like Salesforce.com and QuickBooks Online.
- Access data no matter where it lives, on-premise or in the cloud.


One dashboard, a live 360° view of your business
- See all your data in one place with live dashboards.
- Monitor live data to keep an eye on important changes.
- See your data update in real time with support for streaming data sources.
- Stay connected to your data with native apps for your phone or tablet.
- Easily share data and collaborate with colleagues.
Explore your data and discover new insights
- Easily get insights from your data with Natural language query, allowing you to ask questions of your data in natural language.
- Drill into interactive reports for underlying detail.
- Visually explore your data and uncover new insights.
- Pin new visualizations to your dashboard to continue to monitor performance.

Power BI FAQs
How much does Power BI cost?
Power BI and Power BI Desktop are free. There is a Pro version that costs $9.99 per user per month and includes more storage, better refresh capabilities, integration with collaboration features of Office 365 and on-premises data connectivity.
What data can I connect to?
Power BI Desktop provides a wide range of connection options such as SQL Server, SSAS, DB2, Oracle, MySQL, etc. From the Power BI service, you can use the Enterprise Gateway to connect to on-premises data sources such as SQL Server, SSAS,DB2, Oracle and MySQL among others.
Can Pro and Free users share between them?
Yes, as long as the dashboard and reports being shared do not have any Pro features content.
What are the advantages of Power BI vs Tableau?
Besides the cost of ownership, Power BI offers real-time data visualization, custom visuals, native mobile support and authoring for iOS, Android and Windows, hybrid, connectivity, and deeper integration with other Microsoft services and products such as Excel, SQL, and Azure.
I have all my reports in Excel/SSRS + SQL, do I need to start from scratch?
No. Actually Power BI integrates with other Microsoft services and products very well. You can directly import your Excel reports into Power BI as they are or use them as a data source. You can also connect directly to SQL (SASAS or DB). Last but not least, you can pin SSRS visuals to your Power BI dashboards, maintaining your current investments and leveraging Power BI for sharing and collaboration.
Can I modify a Content Pack?
Yes, you can. You can modify the dashboard and the report. The Data Model cannot be modified since it’s prebuilt.
In what languages and regions is Power BI supported?
Power BI is supported in 42 languages.


